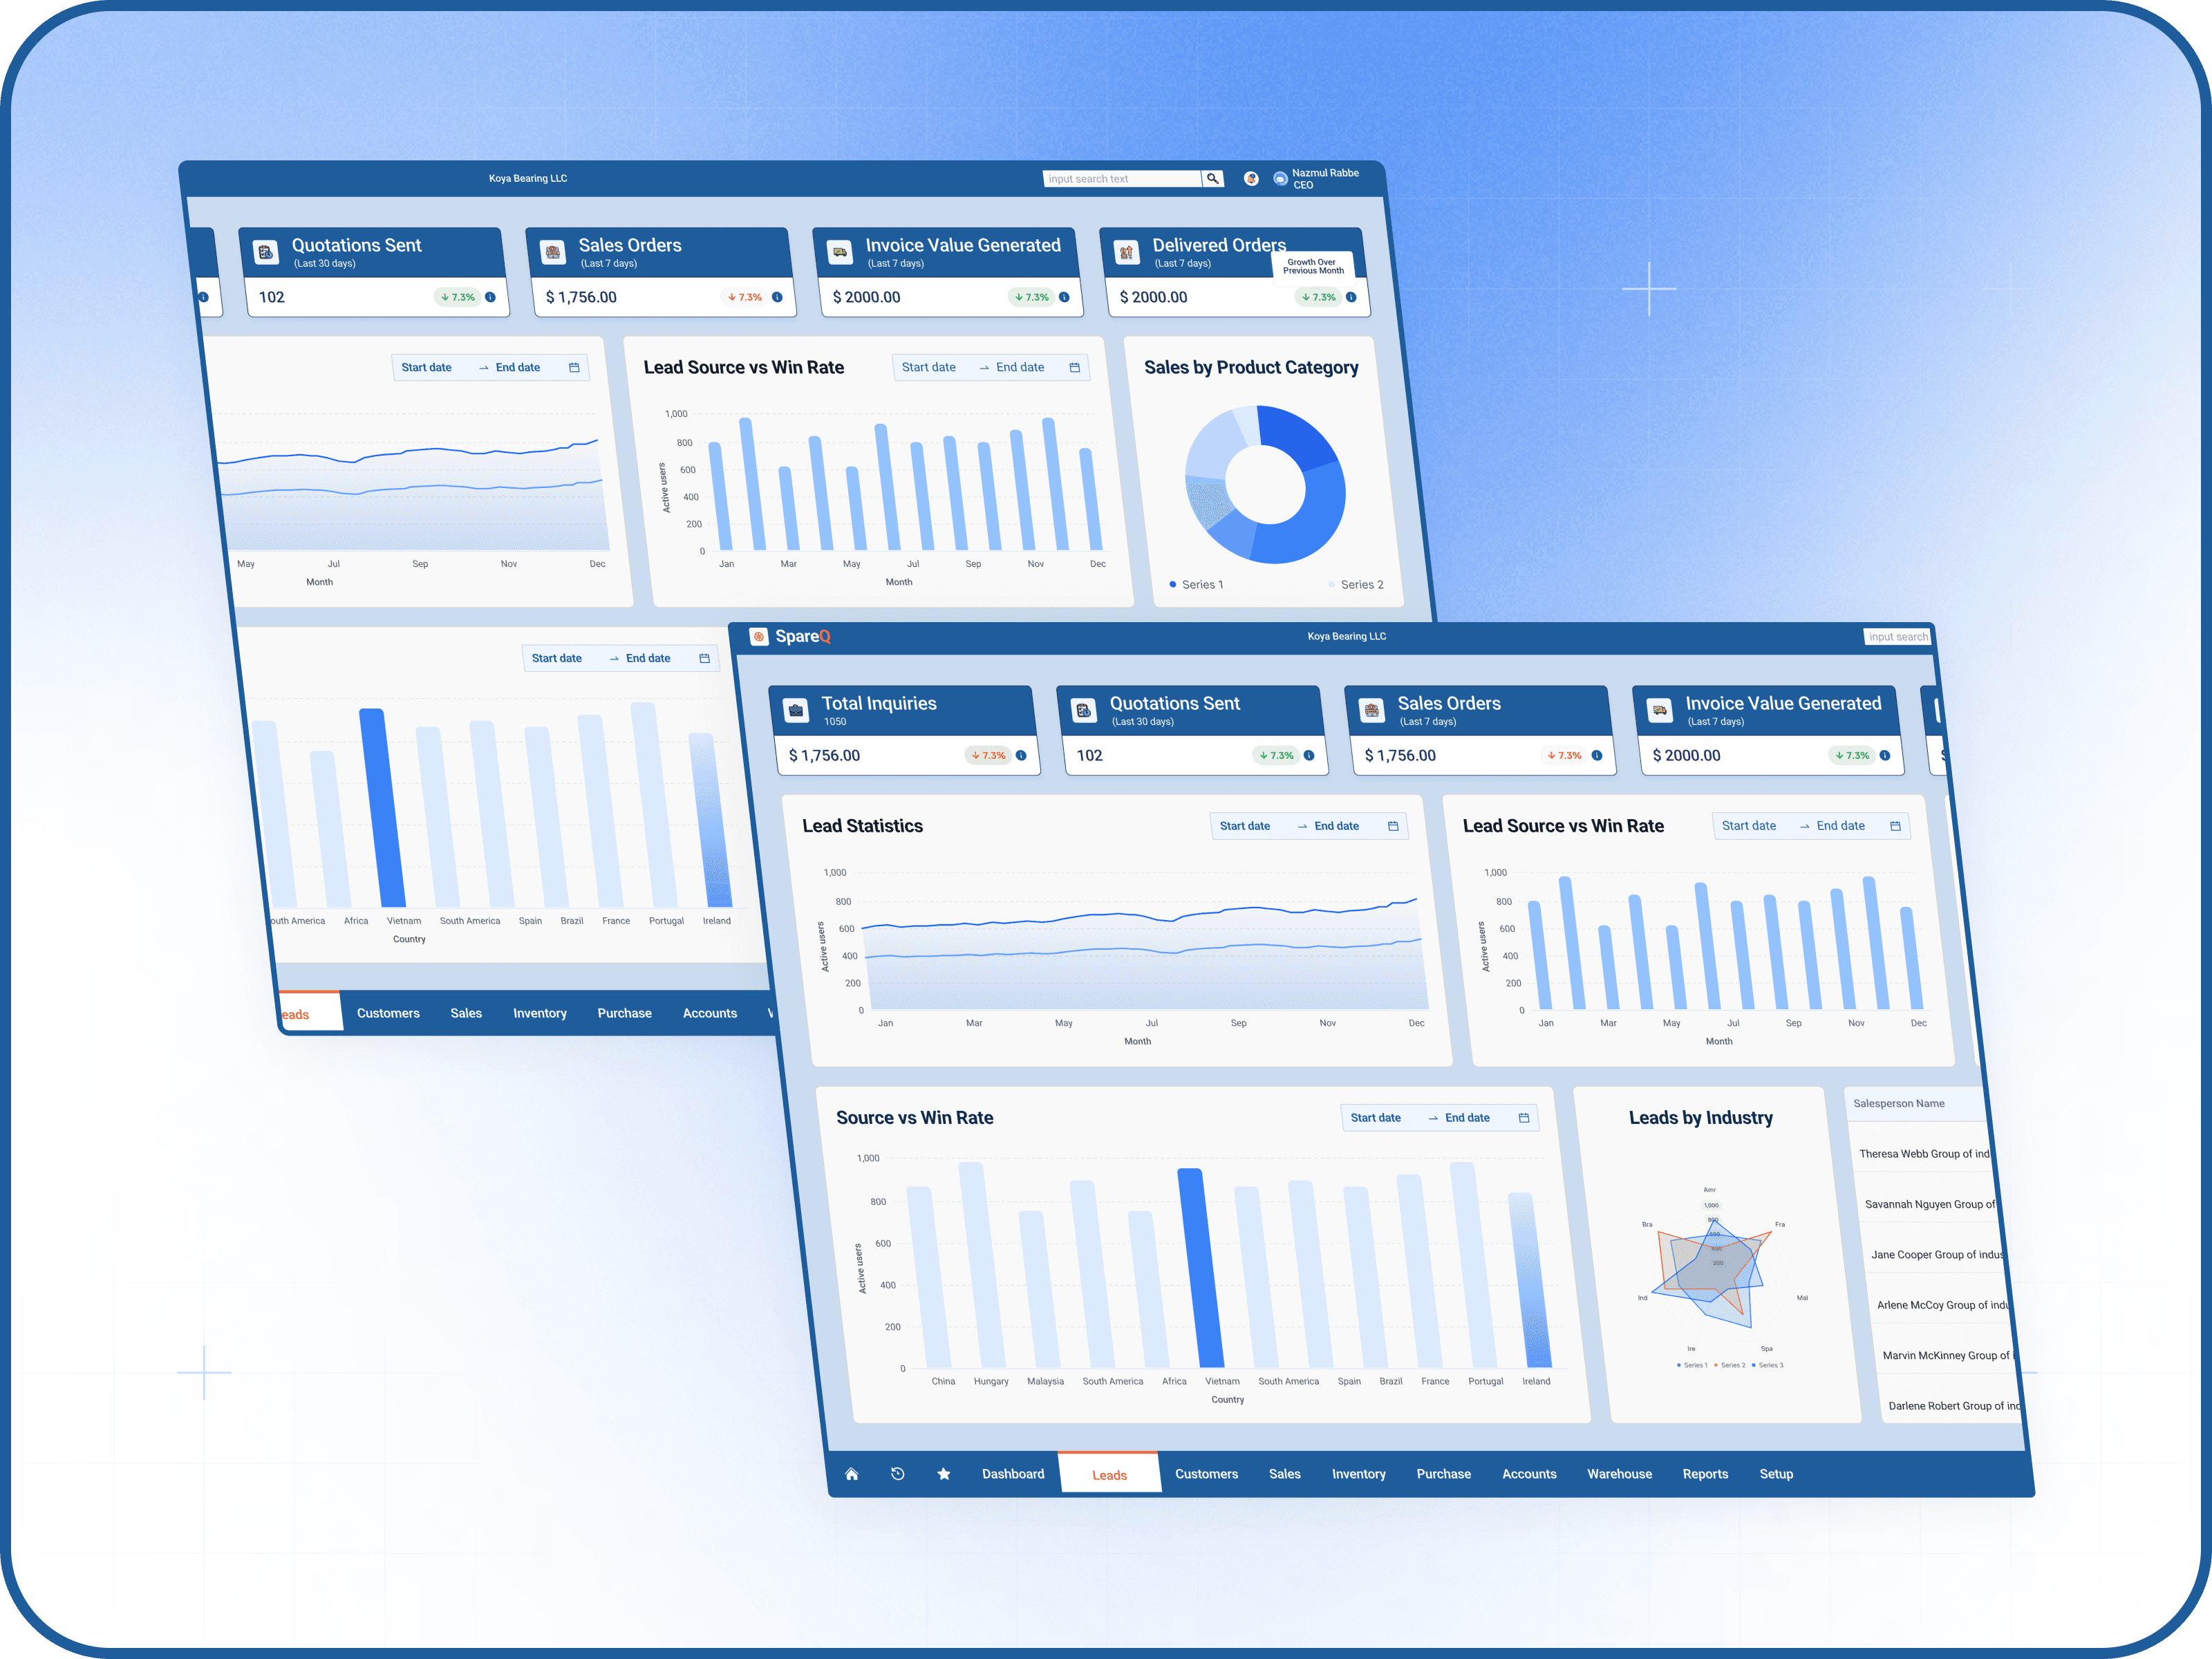
Sales Intelligence & Performance Analytics Hub
A centralized sales intelligence hub that transforms fragmented lead and order data into strategic business insights for data-driven decision-making.
Services
Sales
Tools
Figma
Value
"One dashboard. Every lead, every sale, every insight — so business owners can stop guessing and start deciding."
Timeline
1 Week

The Challenge
Sales teams and business owners operate with information scattered across systems: orders here, invoices there, lead sources nowhere. Without a unified view, they can't answer critical questions like "Which industries generate the most qualified leads?" or "What's our true conversion rate by source?" This fragmentation kills momentum—leaders waste time stitching data together instead of acting on i
The Approach:
I designed a consolidated command center that brings all the pieces together:
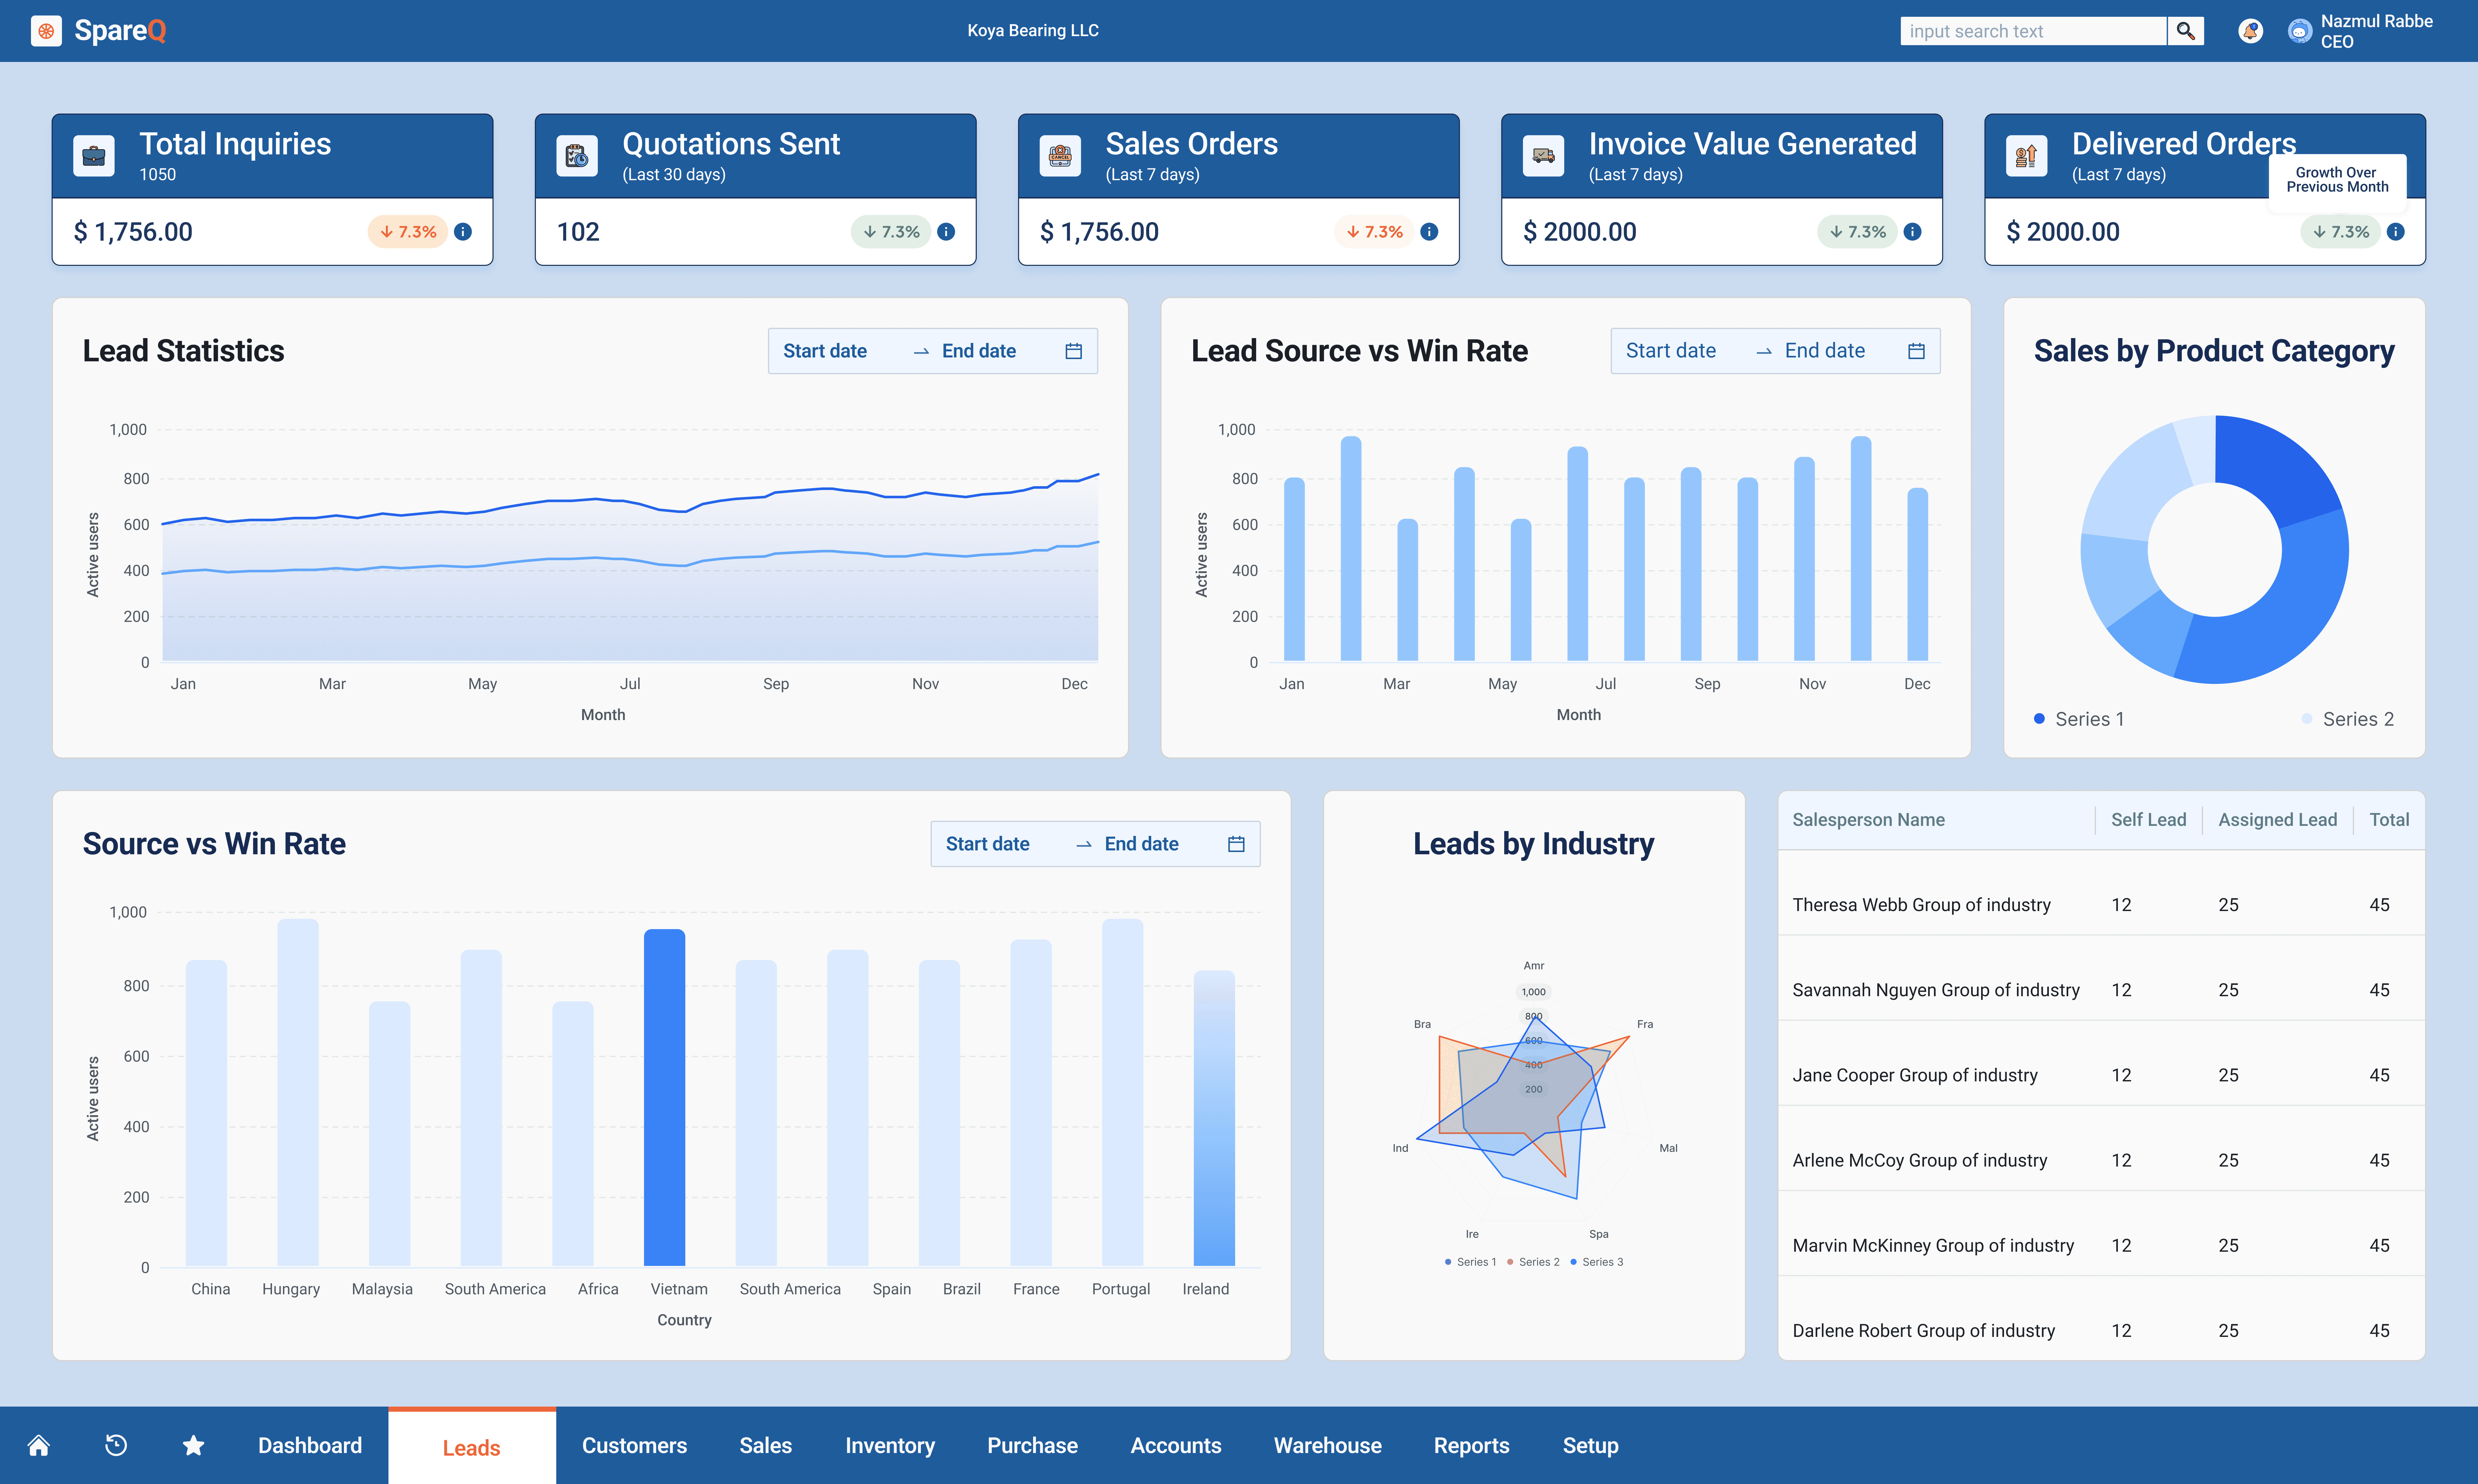
KPI Cards at the Top: Delivered Orders, Sales Orders, and Invoice Value Generated offer immediate business health checks with trend indicators (% change).
Visual Data Hierarchy: A pie chart (Sales by Product Category) answers "what sells," while bar and radar charts address "where leads come from" and "which industries win."
Strategic Layout: The dashboard uses a staggered, modular grid that balances information density with scannability—no overwhelming walls of text or buried metrics.
Color & Accessibility: A professional blue palette builds trust while maintaining contrast for clarity. Each visualization type is distinct, helping users quickly parse different story threads.